I started this blog post with a warning mainly because I’ve seen a lot of engineers and database administrators spend so much time figuring out the root cause of why a SQL Server database running on a WSFC is offline – while it is still offline. I know because I used to be like that. I want to find out the real reason why so that I can take proactive steps in preventing it from happening again.
There’s nothing wrong with finding the root cause of a problem. In fact, we should try our best to “really” find out why the problem occurred in the first place. But do you remember the main goal of why we are running SQL Server on a WSFC? It is to keep it highly available (refer to Focus on The Main Goal of Part 1 of this series). You only start doing root cause analysis (RCA) after the issue has been resolved.
Your Last Option
If the methods provided in part 1, part 2 and part 3 of this series of blog posts did not work for you and your SQL Server databases are still offline, then, analyzing the cluster debug log maybe your last option. The cluster debug log (or more commonly known as the cluster.log) provides a more detailed logging information about what’s going on in the WSFC. You will have more (and potentially overwhelming) information available to help with the troubleshooting process. Let’s start with generating the cluster debug log.
Generating the Cluster Debug Log
In the past, I’ve used cluster.exe command to generate the cluster debug logs for analysis. When Windows Server 2008 introduced PowerShell cmdlets for WSFC, I immediately ditched cluster.exe.
You can generate the cluster debug log by running the Get-ClusterLog PowerShell cmdlet. This will generate a log file for all (or specific) nodes in the WSFC. By default, it will store the cluster debug log files in the C:\Windows\Cluster\Reports folder.
Being a lazy guy that I am, here are the two parameters that I frequently use with the Get-ClusterLog PowerShell cmdlet and why I use them.
- Destination – Didn’t I say I’m lazy? I don’t want to navigate to the default path just to retrieve the generated files. I use the Destination parameter, passing the dot (.) value to store the generated log files wherever I am in the PowerShell command line. This makes it easy for me to open the log files using Notepad – I can just tab-complete the filename within the PowerShell command window. Below is how I use the Destination parameter.
PS C:\> Get-ClusterLog -Destination .
PS C:\> notepad hostname_cluster.log
- TimeSpan – Sometimes, when I get called in to resolve an availability issue for SQL Server databases running on WSFC, the first thing that I do is run this PowerShell cmdlet and pass the TimeStamp parameter to include the events leading up to the incident. For example, if I get called in at 11:00 AM and the customer tells me that the databases (SQL Server failover clustered instance or Availability Group) have been offline for roughly 30 minutes, I immediately collect – not analyze, just collect – the cluster debug log so that I don’t get overwhelmed with the amount of data that I need to analyze later on when doing the RCA. Below is how I use the TimeSpan parameter, passing 40 (minutes) as a value. I used 40 and not 30 because I assume that the customer may not have immediately reported the issue. The log files will only contain the events that happened in the last 40 minutes. This parameter makes targeting a specific time frame much easier.
PS C:\> Get-ClusterLog -Destination . -TimeSpan 40
One thing to note about the timestamps written in the log files – they are in UTC format. This is because you can have WSFC nodes in different geographical regions and time zones. Think SQL Server Availability Groups with replicas on a different data center for disaster recovery purposes. So, when you’re correlating the events in the log, be sure to use the UTC time as a reference. Alternatively, you can use the -UseLocalTime parameter to generate the logs using the servers’ local time.
How I Read The Log Files
Once the log files are generated, I open one up (the number of log files depend on the number of nodes in the WSFC) using any text editor, Notepad being the most common one because it’s available on every Windows installation.
Here’s how I read the log files to start analyzing the issue. Again, I only do this after the issue has been resolved or when all the first three options I mentioned in the earlier blog posts were not enough for me to fix the issue.
- Hit Ctrl + End. This will move the cursor the the very end of the log file. Why would i want to do that? Because the log files are generated sequentially, with the earliest event at the top and the latest one at the bottom.
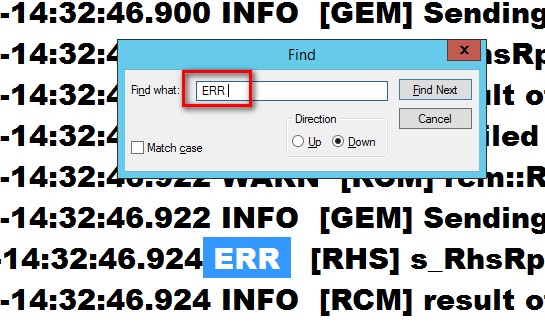
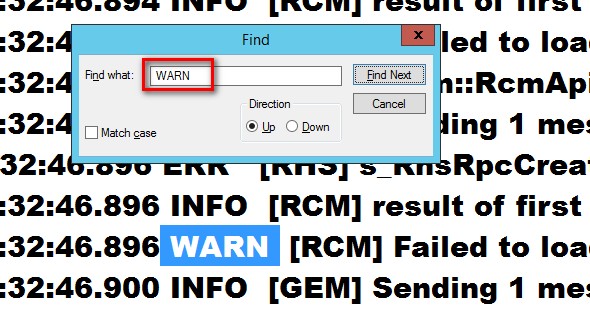
- Hit Ctrl + F. This will open the Find window so I can start searching for specific text. Here are the two that I look for
- <space>ERR<space><space> – note that I included a space before the text ERR and two blank spaces afterwards. I use this to locate the latest error event written in the log without having to go thru some names or keywords that have the ERR text in them, for example, an Availability Group named TERRA. Refer to the screenshot below.

- <space>WARN<space><space> – same as with the ERR text. I use this to locate the latest warning event written in the log. Refer to the screenshot below.

- Hit Alt + U. Since I’m at the end of the file, I want to start searching for the latest entry – be it for ERR or WARN. This will search the file upwards instead of the default downwards.
- Hit Alt + F. Start the search.
As you go thru the cluster debug log, you need to know what the event messages mean so that you don’t waste time trying to understand everything. I still don’t know every single event message but I try to focus first on what the ERR or WARN events are telling me to make sense of what happened and why.
In the next blog post, we’ll look at reading the event messages and how to decipher what those messages mean.
Hi Edwin,
Great post, as always !
“One thing to note about the timestamps written in the log files – they are in UTC format. This is because you can have WSFC nodes in different geographical regions and time zones. Think SQL Server Availability Groups with replicas on a different data center for disaster recovery purposes. ” – Finally I know why certain logs are generated in UTC format.
Appreciate your great work !!
Br,
Anil
Thanks for reading my blog post, Anil.
Saved my day! Thank you E!